Public lighting, light pollution, circadian rhythm, blue component – these terms have been frequently mentioned lately. Sodium lamps are being replaced by LED sources, which save energy but also have their downsides in the form of unnatural color – a higher proportion of blue light. This can affect the circadian rhythm of humans and, of course, the fauna and flora around the lamp.
After watching an interview with an unnamed lighting expert, who also has a business selling his light sources, I thought of building my own light spectrum analyzer.
I had the idea, but not the knowledge 🙁 . So I turned to AI for help – both for calculations and for checking the process. I used several AIs to cross-check each other.
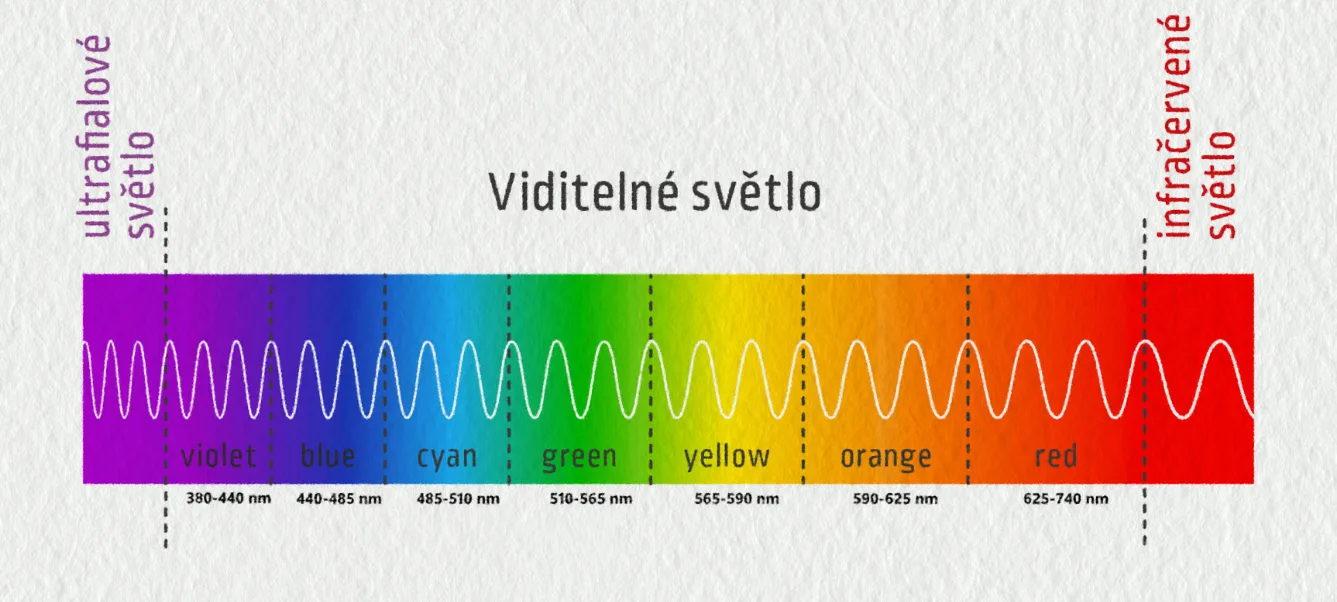
I approached the project as a portable light spectrum analyzer that can measure the light spectrum in the range of 410–940 nm, evaluate the proportion of the blue component, the coldness index of the light, and calculate the correlated color temperature – CCT.
This project was created in collaboration with the e-shop http://botland.cz/, which had the necessary hardware in stock.
Used Hardware
Inkplate 5 Gen2
The main control and display element is the board Inkplate 5 Gen2, which contains an ESP32 microcontroller and a 5″ ePaper display.
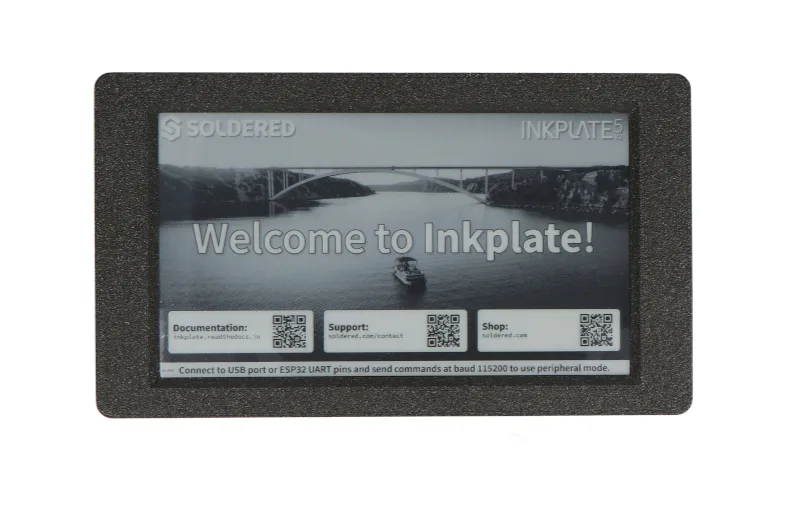
Inkplate offers various sizes, colors, and resolutions of ePaper displays already attached to the control board. Inkplate is a ready-made product that can be used as is. On the board, besides the attached ePaper display, you will find a variety of peripherals that you can use: RTC, microSD, I2C, GPIO header for connecting additional boards or sensors. It also has an easyC connector, which is compatible with SparkFun Qwiic and Adafruit STEMMA.
Parameters of Inkplate 5 Gen2:
- resolution: 1280 × 720 px
- controlled by ESP32
- very low consumption (18 uA)
- supports 1bit (black and white) mode for faster refresh, also supports grayscale (6 shades of gray)
- full redraw in under 1s, partial refresh in 0.22s
- power button and wake-up button
- additional peripherals directly on the board (RTC, microSD slot, and more)
- Support in Arduino IDE and MicroPython
- built-in 1200 mAh battery
Advantages:
- excellent readability in sunlight
- minimal consumption between updates (only 18 uA)
- sufficient power for processing spectral data and related calculations
- does not emit light, thus does not affect measurements and there is no need for special lighting covers for the display
- glued ePaper, which is more resistant to damage
Why did I choose to use an ePaper/eInk display for visualization instead of a classic TFT?
I aimed to create a device that would be portable and last on battery for days. ePaper does not emit light, so there is no need to address sensor shielding from unwanted light from a TFT display.
Inkplate 5 Gen2 is completely open-source and you can find the data on their github, including a model for 3D printing. I printed a modified case, and the model is very well designed for easy and trouble-free printing.
ePaper/eInk is also an interesting display technology that can be used for other projects like weather stations, custom information displays, or information displays connected to Home Assistant.
Light Spectrum Sensor AS7265x (AS72651, AS72652, AS72653)

The heart of the project is the module AS7265x, which contains three sensors:
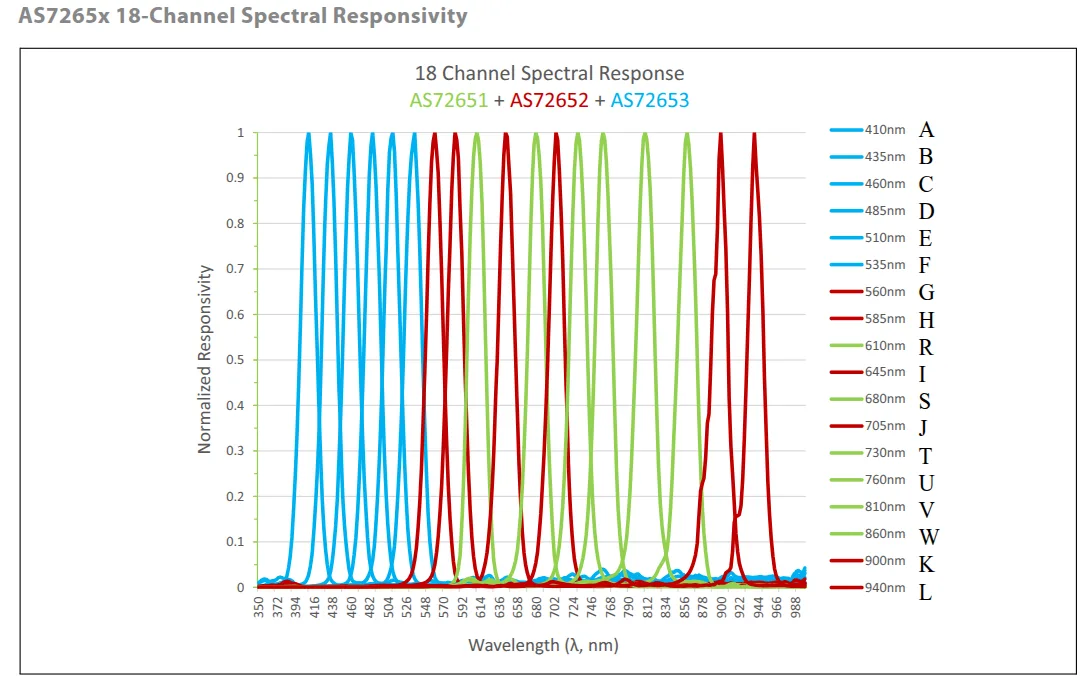
In total:
- 18 spectral channels from 410 to 940 nm – thus a much wider measurable range than the visible spectrum
- I²C interface
- Ability to control lighting, RGB LED, and similar
The AS7265x spectral sensor module measures a much wider range of wavelengths than necessary. It can thus be used for other projects as well.
I used shielding for this sensor from github of this project.
Used Libraries
The project uses the following Arduino libraries:
- InkplateLibrary https://github.com/
- SparkFun AS7265X https://github.com/
InkplateLibrary contains a lot of simple and very advanced example programs.
For this, you need to install support for Inkplate boards.
Arduino IDE -> File -> Preferences -> Additional boards manager URLs
https://github.com/SolderedElectronics/Dasduino-Board-Definitions-for-Arduino-IDE/raw/master/package_Dasduino_Boards_index.json
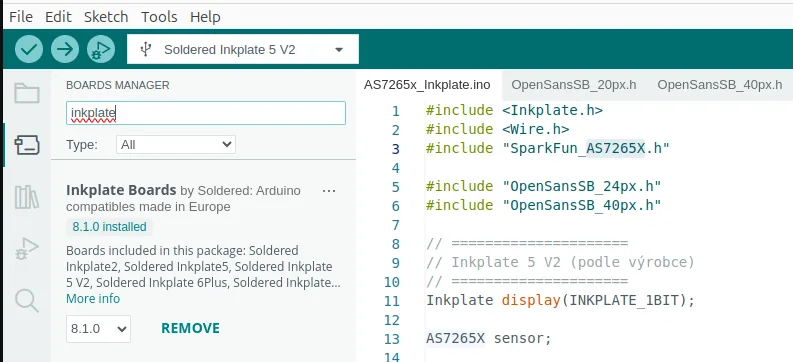
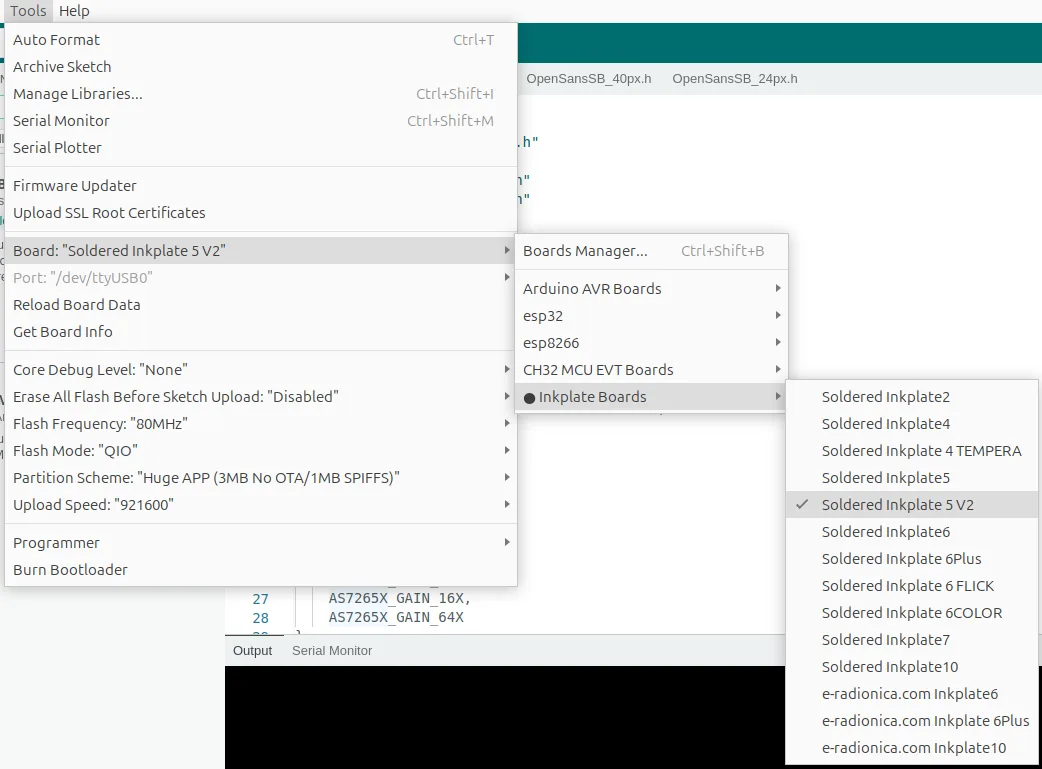
I compile the project in Arduino IDE with this board setting.
What the Device Measures
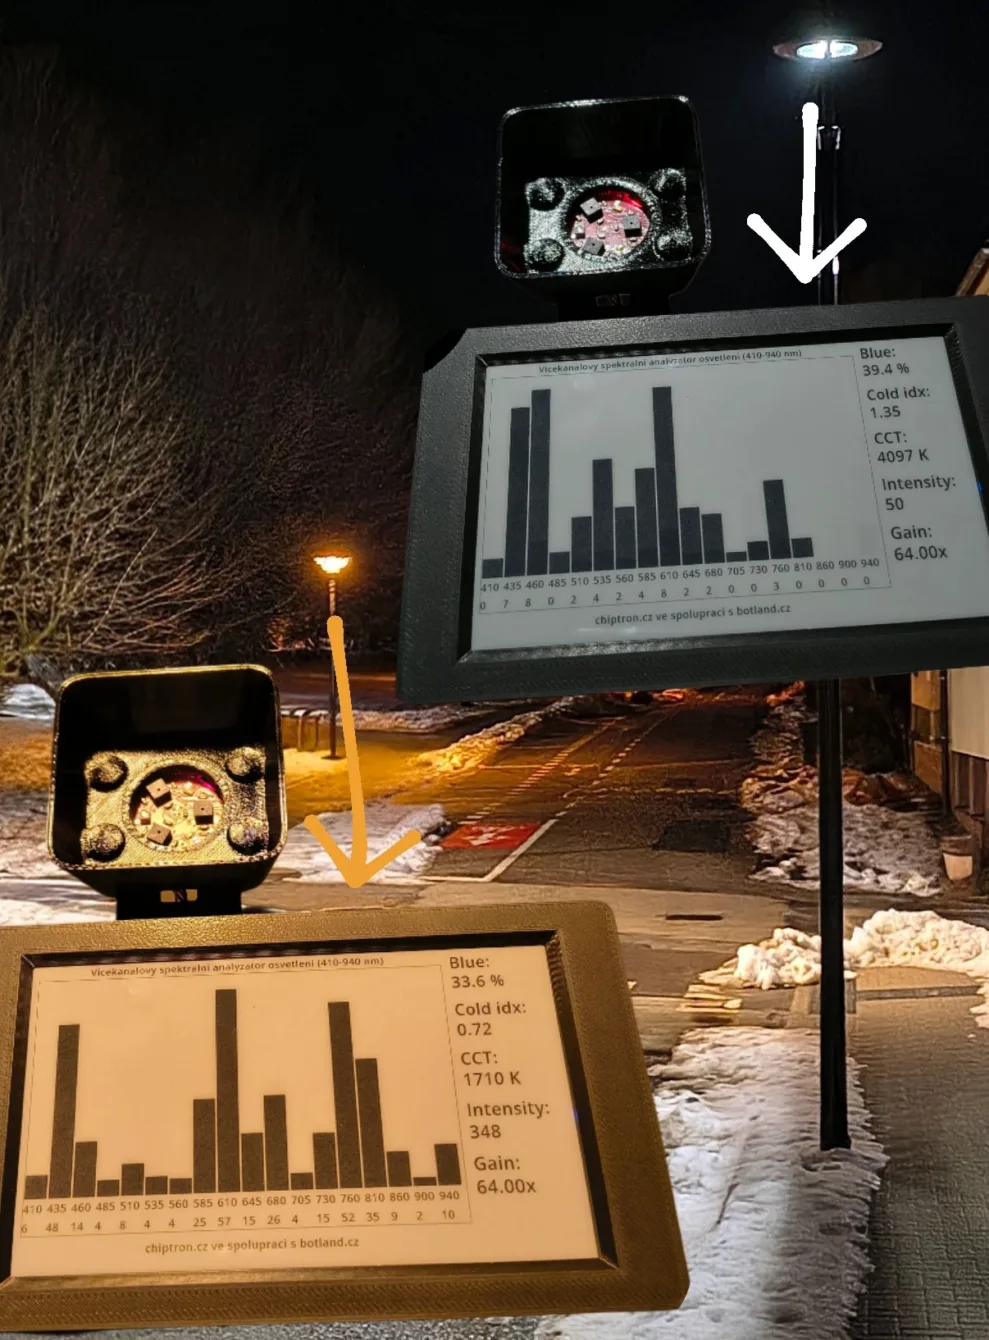
1) Light Spectrum
The display shows a bar graph of all 18 channels, which allows recognizing the type of light source based on the shape of the spectrum:
- LED – narrow blue peak (around 450 nm) complemented by a wide phosphor band in the rest of the spectrum
- Sodium lamp – minimum blue component, dominant narrow yellow-orange spectrum
- Halogen / sun – continuous, smooth spectrum without distinct peaks
During spectrum measurement, the sensor gains are automatically adjusted – the sensitivity of the sensors – allowing for the measurement of very weak light sources as well as very strong ones (the sun).
2) Proportion of the Blue Component
The proportion of the blue area is defined as:
Blue = sum of channels 410–485 nm
Visible = sum of 410–675 nm
Blue_ratio = Blue / VisibleThis parameter is key for assessing light pollution and the biological impact of light.
3) Coldness Index
The ratio of blue to red components:
Cold_index = Blue / Redwhere:
Red = sum of 610–705 nm
Values:
- low → warm light
- high → cold LEDs
4) Calculation of Correlated Color Temperature (CCT) from the Spectrum
This calculation serves to estimate the correlated color temperature (CCT) of light based on the measured spectrum at 12 wavelengths (410–705 nm). The result is a value in kelvins that describes the color character of the light – from warm (yellow) to cold (blue).
The input field contains the intensities of individual spectral channels – 18 channels from the AS7265x module. The function first calculates the tristimulus values X, Y, Z from them.
These values are generated as weighted sums:
- X – represents a combination of red and green components (broad spectral sensitivity)
- Y – corresponds to brightness (photopic sensitivity of the human eye, maximum around 555 nm)
- Z – primarily represents the blue area of the spectrum
The coefficients used are a simplified approximation of the standard CIE 1931 color functions adapted to the discrete channels of the sensor.
Significance:
- More energy in blue → higher Z → cooler light
- More energy in red → higher X → warmer light
The measured values X, Y, and Z are first converted to chromaticity coordinates x and y, which describe the color of the light itself without the influence of its intensity (normalizing by the sum of X+Y+Z).
From these coordinates, the correlated color temperature (CCT) is subsequently calculated using a quick McCamy approximation, which converts the color position in the CIE diagram to temperature in kelvins.
Since this method is accurate only approximately within the range of common light sources, the resulting value is limited to the range of 1000–12000 K to avoid unrealistic results caused by noise or atypical spectra.
The entire procedure is designed as a fast and computationally inexpensive method suitable for microcontrollers and spectral sensors in embedded applications.
| CCT (K) | Light Source | Light Character |
|---|---|---|
| 1800 K | Candle | Very warm, reddish |
| 2700 K | Incandescent / halogen | Warm white |
| 3000 K | Warm white LED | Slightly warm light |
| 3500 K | Neutral warm lighting | Offices, shops |
| 4000 K | Cool white | Neutral, slightly technical |
| 5000 K | Daylight at horizon | Bright neutral light |
| 6500 K | Overcast sky / D65 | Standard reference daylight |
| 8000 K | Heavily overcast / shade | Clearly bluish |
| 10000 K and more | Bright blue sky (without direct sun) | Very blue light |
6) Light Intensity
The sum of the visible range 410–940 nm is used:
Intensity = TotalThis is not lux (measured light intensity), but a relative (dimensionless) value suitable for comparing sources with each other.
Automatic Sensitivity Regulation
AS7265x allows setting the sensitivity:
- 1×
- 3.7×
- 16×
- 64×
Algorithm:
- at low intensity → increase gain
- at high intensity → decrease gain
As a result, the device works from dark environments to direct lighting from a lamp or sunlight without saturating the sensors.
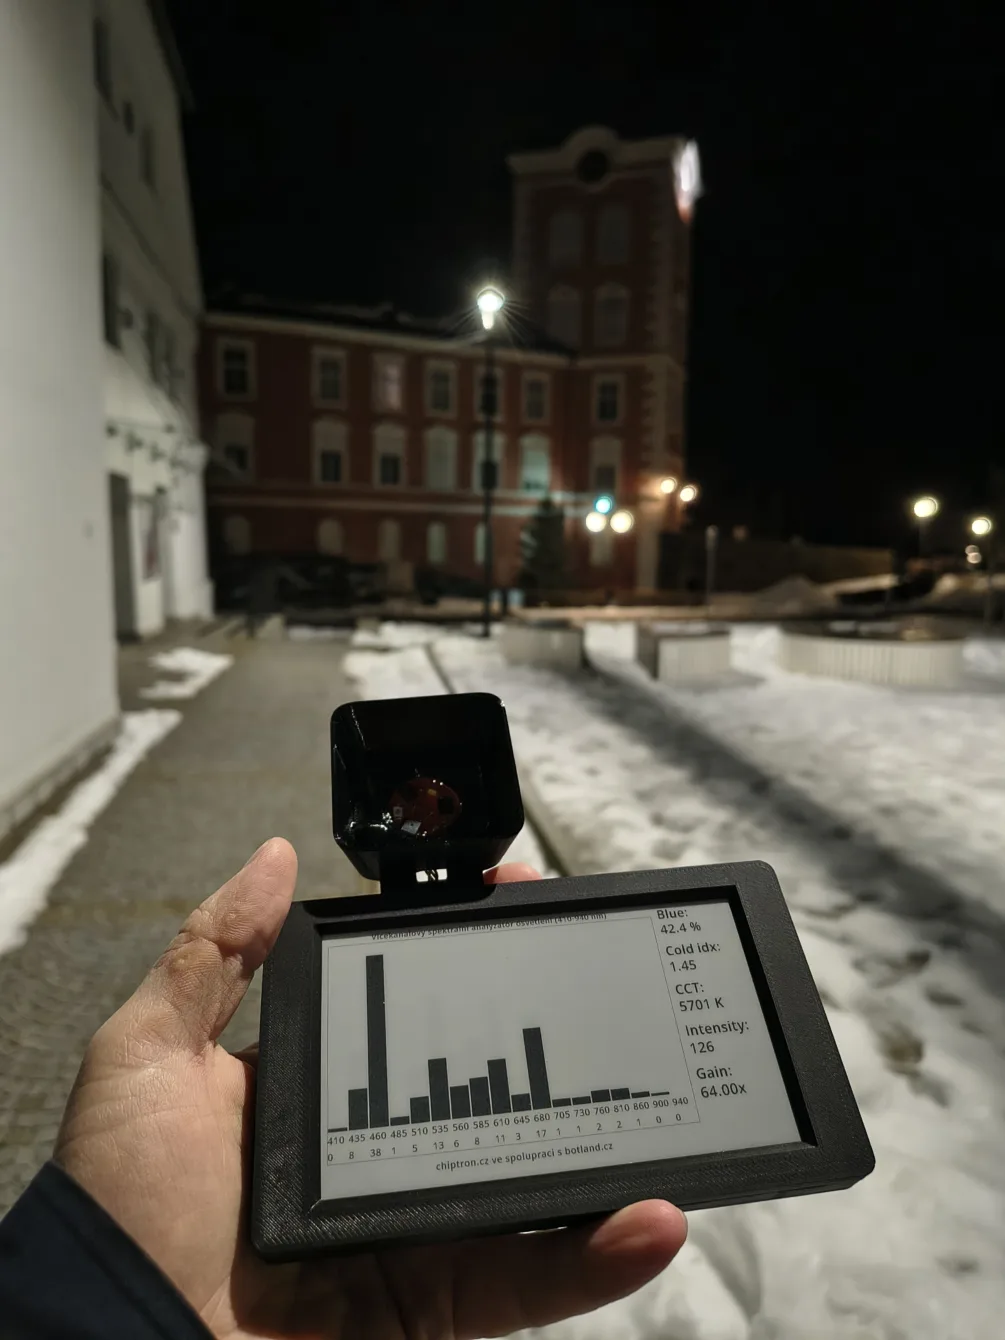
Display on Inkplate
The display is divided into two parts:
Left Part
- spectrum graph 410–940 nm
- wavelength labels
- current channel values
Right Part
- Blue %
- Cold index
- CCT
- Intensity
- current Gain (amplification)
Updates occur every 30 seconds.
Problems and Measurement Errors Using This Device
What I haven’t mentioned so far is that this project does not aim to compete with professional measuring devices.
While the sensor used is among the higher quality ones, the problem is that the device is not “calibrated” in any way. I do not have a reference light source to relate the results to.
Moreover, the calculations were created by AI… and they might not even be more accurate than the results of cheaper spectrometers? Who knows.
However, after calibration with a reference light source, these calibrations could be included in the code and automatically added or subtracted across all channels.
Then this spectrometer project could become a very high-quality device for measuring lighting and its parameters. Currently, it is an indicative device for comparing light spectra from various light sources.
Creating the algorithms for the calculations involved Claude + chatGPT + Perplexity and their mutual verification of the calculations.
Conclusion
The project aims to inspire readers with an interesting design of a generally useful device using commonly available components.
Even though I lack knowledge about lighting and measuring light spectra, we managed to put it together with AI 😀
The combination of Inkplate 5 Gen2 and the sensor AS7265x thus allows creating a relatively inexpensive but very capable light spectrum analyzer. The project shows that even with commonly available hardware, one can obtain information that ordinary light radiation spectrometers do not provide.
When we consider that we have a reference light source with which we can “calibrate” our spectrometer.
The result is a device that can not only display the light spectrum but also evaluate its biological impact and quality.
The code for ESP32 (Inkplate 5 Gen2) and the sensor module can be found on github.
This project was created in collaboration with the e-shop http://botland.cz/, which had the necessary hardware in stock.

