Anyone who’s ever programmed an Arduino or ESP32 knows the ritual: upload the sketch, open Serial Monitor in the Arduino IDE, and watch the stream of numbers to check whether the sensor is returning sensible values. It works great – until you’re sitting at someone else’s machine, on a school Chromebook, or a tablet with no IDE installed. That’s exactly why this tool exists: no install, free.
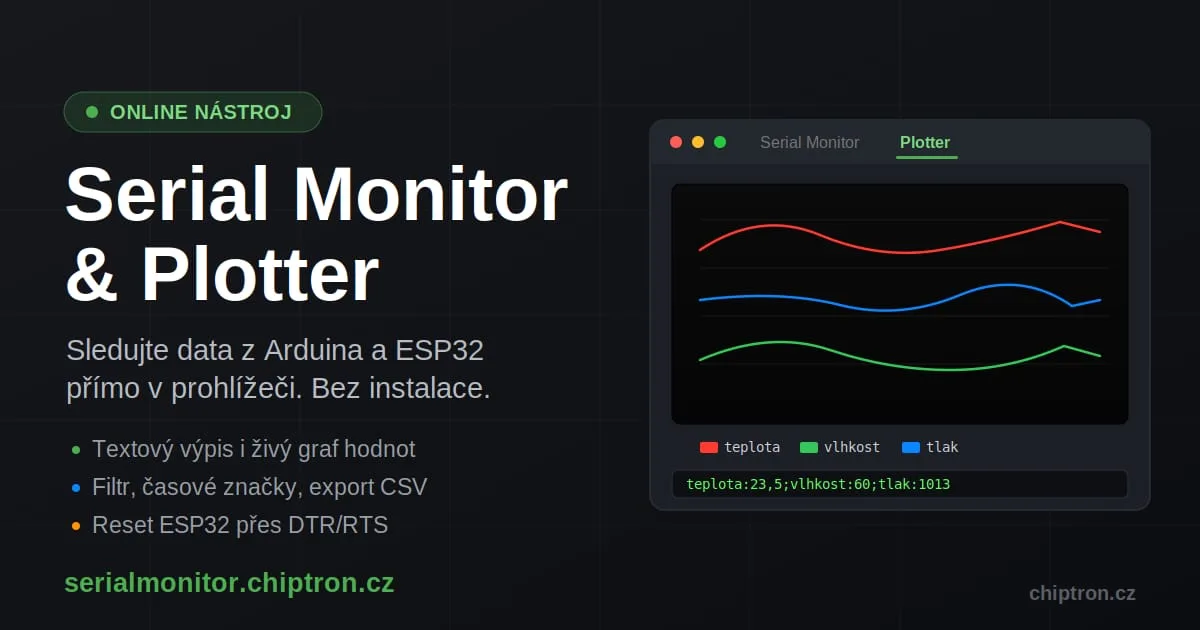
At serialmonitor.chiptron.cz I’ve launched an online Serial Monitor with built-in plotter. It runs entirely in the browser, nothing to install, yet you can still plug a board in over USB and watch live data – both as text and as a real-time graph.
How does it work without installing anything?
The secret is the Web Serial API – a browser interface that lets modern browsers talk directly to serial devices. No drivers, no bridge, no install. Click “Connect”, pick the COM port (or /dev/ttyUSB… on Linux) and you’re off.
One catch: Web Serial API is currently supported only by Chromium-based browsers – Google Chrome, Microsoft Edge, Brave, Opera and the like. Firefox and Safari don’t have it yet. If the Connect button does nothing, it’s almost certainly the browser.
Both the monitor and the plotter are localised into Czech and English, following your browser language preference. You can switch languages manually and the choice is remembered.
What the Serial Monitor can do
The original Serial Monitor was just “a text window”. It’s better now.
The tool has two tabs – Serial Monitor and Plotter – that share a single connection, so you can switch between text and graph without unplugging the board.
Serial Monitor tab
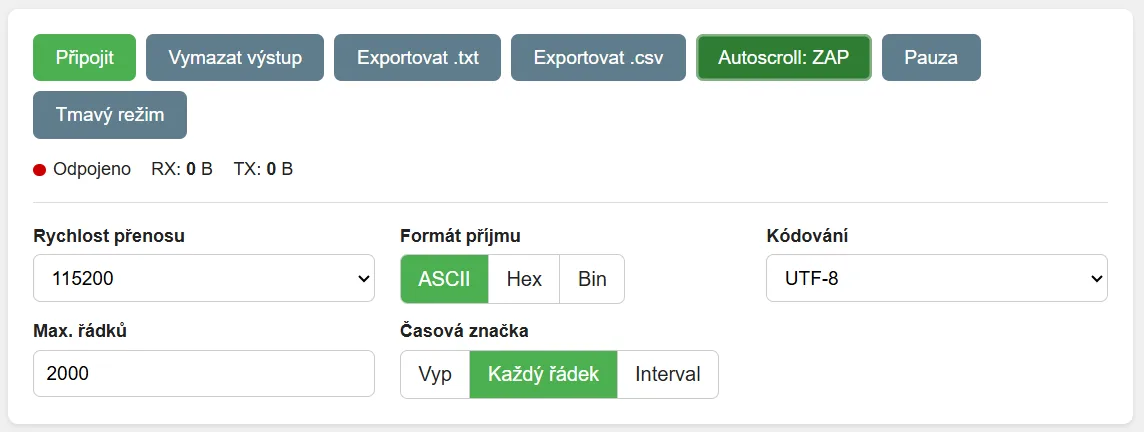
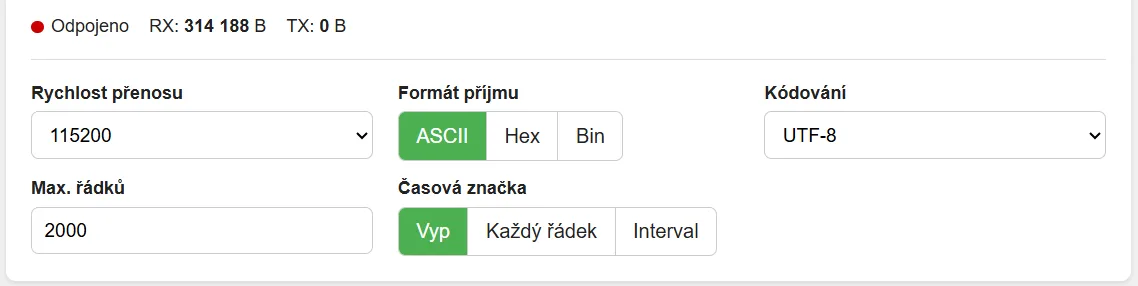
- Selectable baud rate – 9600 to 115200 plus a custom field.
- Three receive formats – ASCII for normal text, Hex and Binary for protocol debugging.
- Timestamps – on every line or at a set interval. Handy when you need to know how fast the data is arriving.
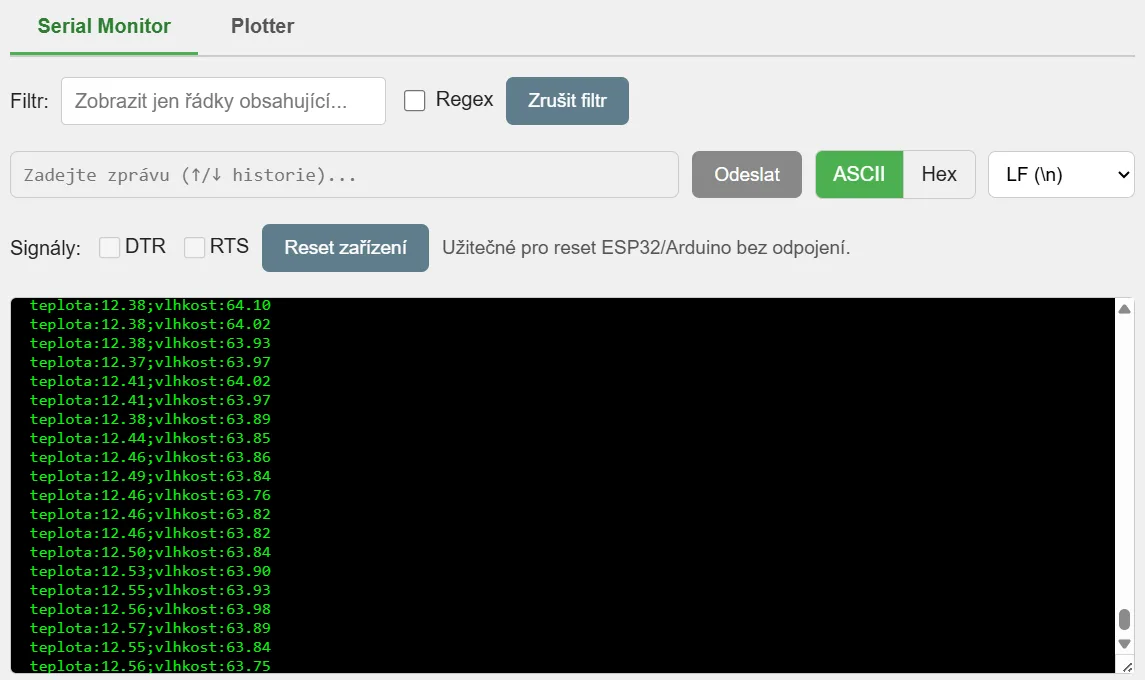
- Output filter – shows only lines containing the search text, optionally with a regular expression. Invaluable on long logs.
- Send back to the device – with command history (arrow keys work like a terminal) and line-ending choices (LF, CR, CRLF or none).
- DTR/RTS control and a Reset button – restart an ESP32 or Arduino without pulling the cable.
- Export to plain text or CSV with timestamps.
- Encoding selection (UTF-8, ISO-8859-2, Windows-1250) – so diacritics from your board don’t turn into garbage.
Settings are remembered – baud rate, light/dark theme, format and command history survive a browser restart. Long sessions at 115200 baud can choke a browser, so the output has a configurable line limit to keep the page responsive.
Plotter tab
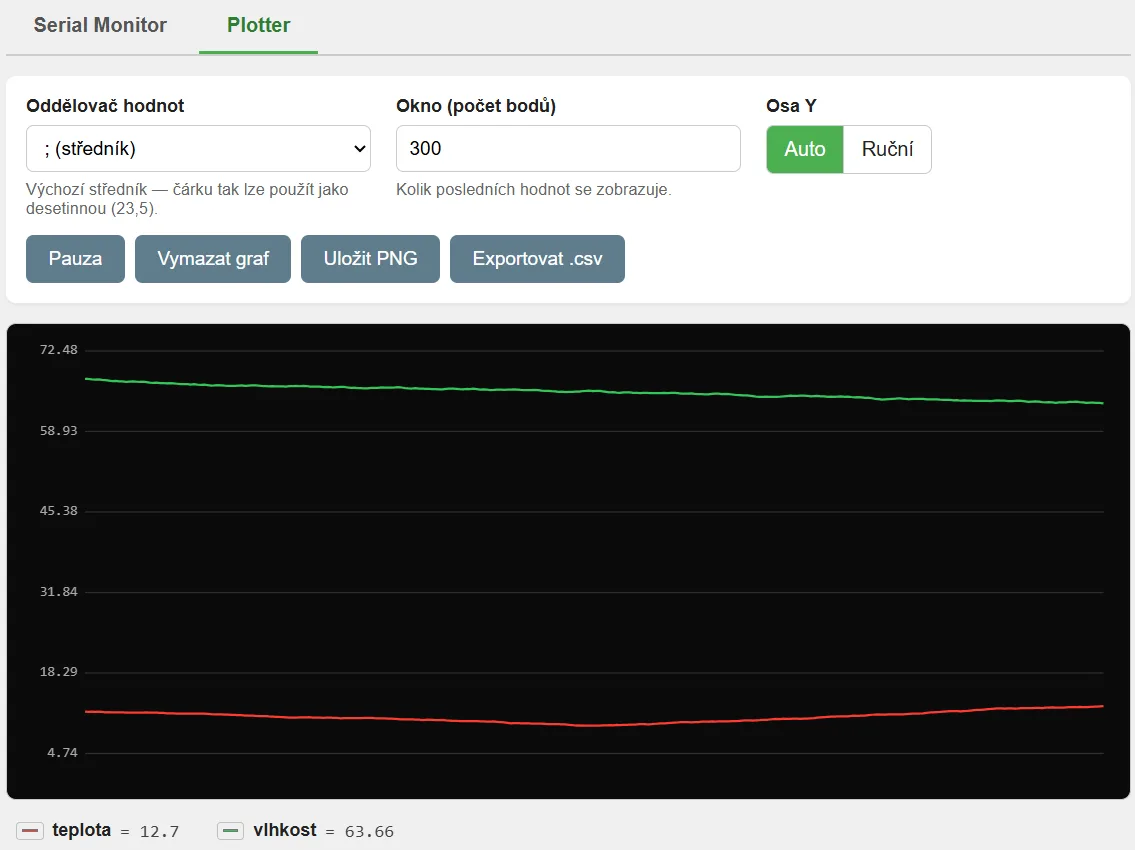
This part is brand new. The plotter draws numeric values from the serial line as a live graph, similar to the Serial Plotter in Arduino IDE but running in the browser with a few extra tricks.
It recognises two line formats automatically:
- Named values –
temperature:23.5;humidity:60;pressure:1013. Each series gets its name from the label and the legend shows exactly what’s what. - Bare numbers –
23.5;60;1013. Series are named automatically (Series 1, 2, 3).
The default separator is a semicolon – deliberate, so the comma stays free as a decimal separator. Both 23,5 and 23.5 work without fuss (microcontrollers send both). You can also switch the separator to comma, tab, space or a custom character.
Each series gets a distinct colour from the palette, but you can change it any time in the legend – just click the colour square. Click a series name to hide it temporarily; the live last value is shown next to the name. The Y axis auto-scales or you can set a fixed range. Save the graph as PNG or export the data as CSV for further processing.
Getting started – practical example
Suppose you have an ESP32 with a temperature/humidity sensor (SHT40 or BME280, for example). To get nice graphs, just send lines in this format from your sketch:
Serial.print("temperature:");
Serial.print(temperature);
Serial.print(";humidity:");
Serial.println(humidity);
Then open serialmonitor.chiptron.cz, click Connect, select your board, set the same baud rate you used in the sketch (usually 115200) and switch to the Plotter tab. Within seconds you’ll see two traces reacting when you breathe on the sensor.
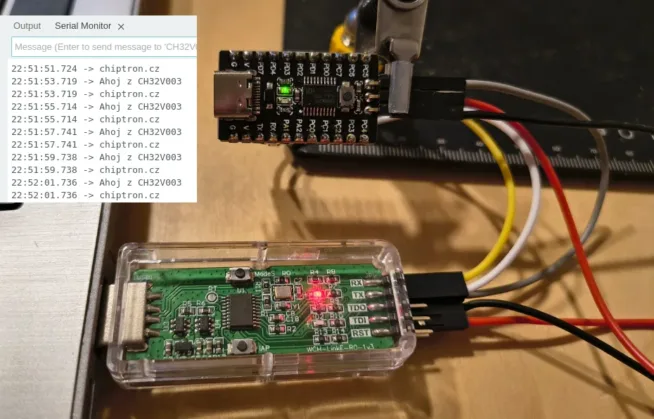
In testing, the monitor and plotter handled temperature and humidity data arriving every 10 ms at 115200 baud. If the browser can’t keep up, it buffers the data.
Who it’s for
The tool is useful whenever you don’t want – or can’t – install a full IDE. Typical situations:
- Teachers and schools – on Chromebooks or shared machines where nothing can be installed; students just plug in an Arduino and see the data.
- Quick diagnostics – check whether a board is sending anything without the overhead of launching an IDE.
- Presentations and workshops – a live graph is far more illustrative than a column of numbers.
- Working on someone else’s computer – on-site visits, customer premises, Maker Faire.
The whole tool is free and runs entirely in the browser – no registration, no install. Serial data never leaves your machine; everything happens locally between the browser and your board.
If the tool helped you, feedback is welcome – what you’d like added or improved. If you run into a device that sends data the plotter can’t parse, let me know and I’ll refine it.
Try the Serial Monitor online: serialmonitor.chiptron.cz
Comparison with other tools
| Feature | chiptron SM & Plotter | Arduino IDE 2.x | PuTTY | CoolTerm | Serial Studio |
|---|---|---|---|---|---|
| Installation | none (web) | required | required | required | required |
| Platform | any Chromium browser (Chrome, Microsoft Edge, Brave, Opera) | Win/Mac/Linux | mainly Windows | Win/Mac/Linux | Win/Mac/Linux |
| Works on Chromebook | yes | no (text monitor only) | no | no | no |
| Text monitor | yes | yes | yes | yes | yes |
| Plotter (graph) | yes | yes | no | no | yes (advanced) |
| Monitor + plotter at once | yes (tabs, single connection) | no (only one at a time) | – | – | yes |
| Graph point limit | configurable (up to 20 000) | ≈ 500 (then restarts) | – | – | high |
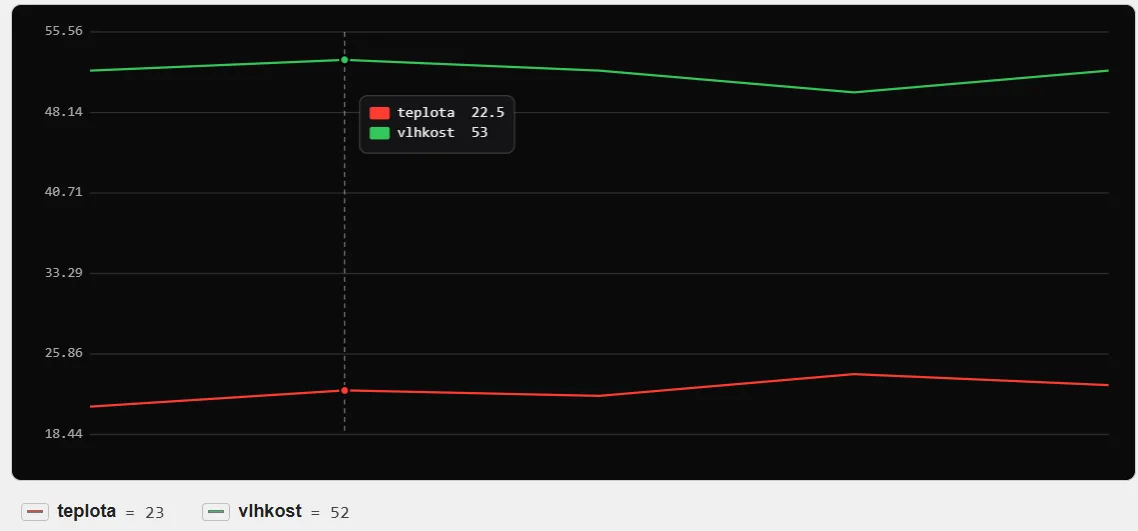
| Mouse value readout (hover) | yes (crosshair + tooltip) | no | – | – | yes |
| Output filter (regex) | yes | no | limited | no | yes |
| Hex / binary view | yes | no | yes | yes | yes |
| CSV export | yes (monitor + graph) | no (manual copy) | no (log only) | yes | yes |
| PNG graph export | yes | no | – | – | yes |
| ESP32 reset (DTR/RTS) | yes (button) | partial | manual | yes | yes |
| Per-series colour choice | yes (live) | no (automatic) | – | – | yes |
| Timestamps | yes (per line / interval) | no | optional | yes | yes |
| Localisation (CZ/EN) | yes (auto-detect) | partial | no | no | yes |
| Price | free | free | free | free (donationware) | free (open-source) |
Arduino IDE’s plotter is unavailable on Chromebooks even via Cloud Editor – only the text monitor works. The built-in Arduino plotter also lacks export; data must be copied manually.

