During a large-scale drone attack on Moscow in the night of 18 June 2026, a fire broke out at an oil refinery in the southeastern part of the city. Amateur sensors connected to the sensor.community network recorded an extreme spike in particulate matter right at the source – PM10 values jumped from typical nighttime levels to peaks exceeding 1000 µg/m³. The map also shows this was a purely local event: most stations across Moscow and the surrounding area reported good air quality thanks to favorable dispersion conditions.
This article does not cover the military conflict. It uses a concrete example to show what amateur air quality measurement can achieve and why data from maker-built sensors have real value.
What happened
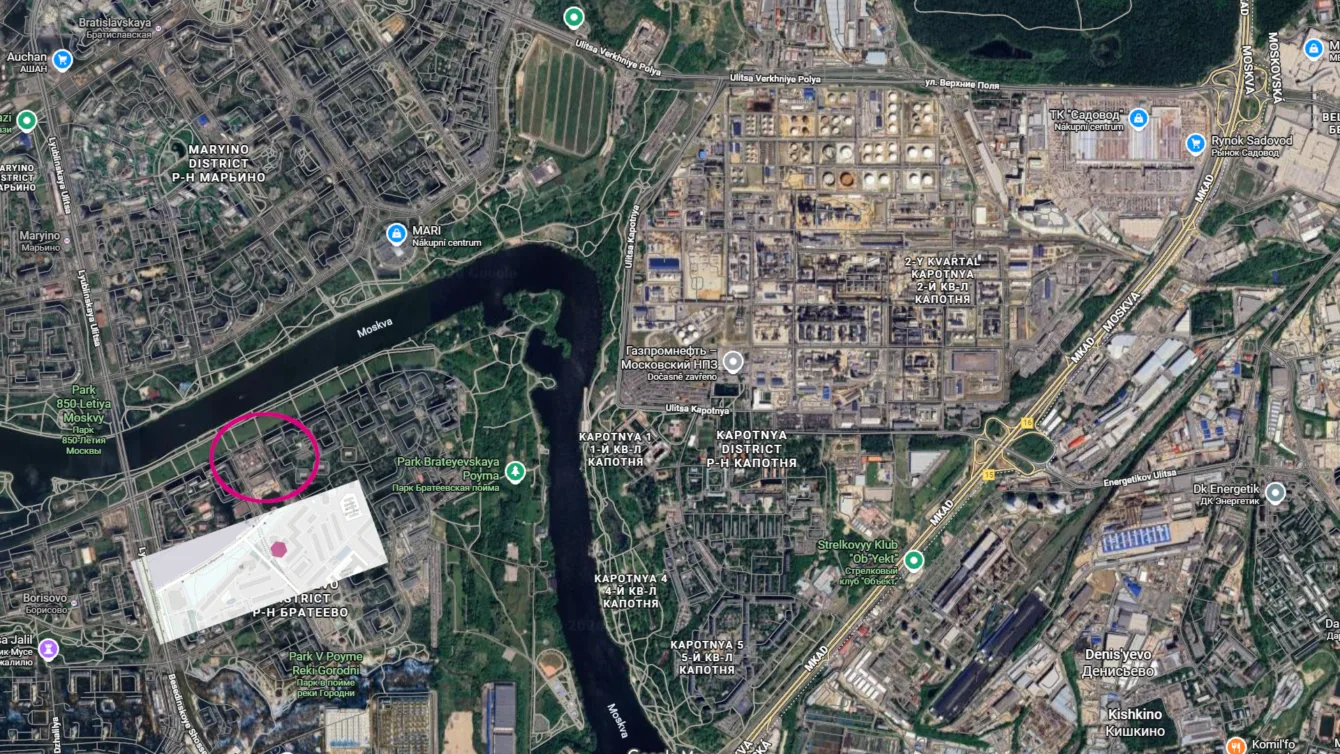
In the night of Thursday 18 June 2026, according to both Russian and Ukrainian sources, the largest drone attack on Moscow since the start of the war took place. One target was the Gazprom Neft oil refinery in the Kapotnya district in the southeast of the city, roughly 15 km from the center. A large fire developed on site and a thick black plume rose over the southern part of the city.
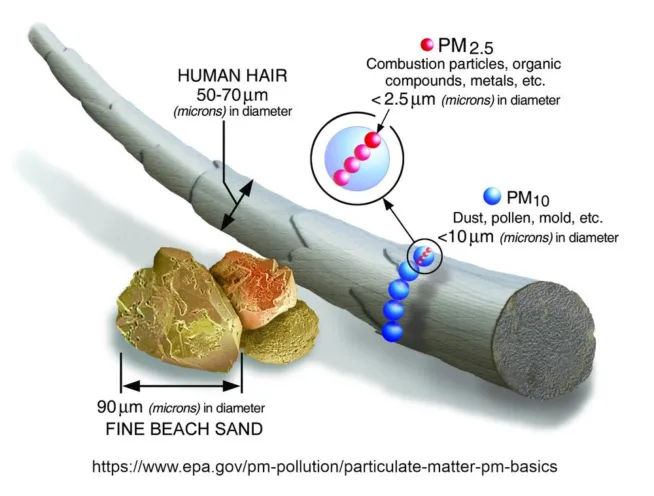
Burning petroleum products release large amounts of fine particulates into the air – exactly what the optical sensors in weather stations measure.
What the amateur sensors recorded
The sensor.community network brings together thousands of amateur and professional sensors worldwide that share their data in real time on a public map. One such sensor sits near the refinery – ID 93424.
Its graph tells the story clearly. All night, both PM2.5 and PM10 stayed close to zero. Around 3–4 a.m. came a sharp jump – PM10 shot up to peaks above 1000 µg/m³, with individual spikes approaching 1500 µg/m³. For context, the regulatory threshold for PM10 is 150 µg/m³, so the sensor was reporting roughly ten times that level at times.
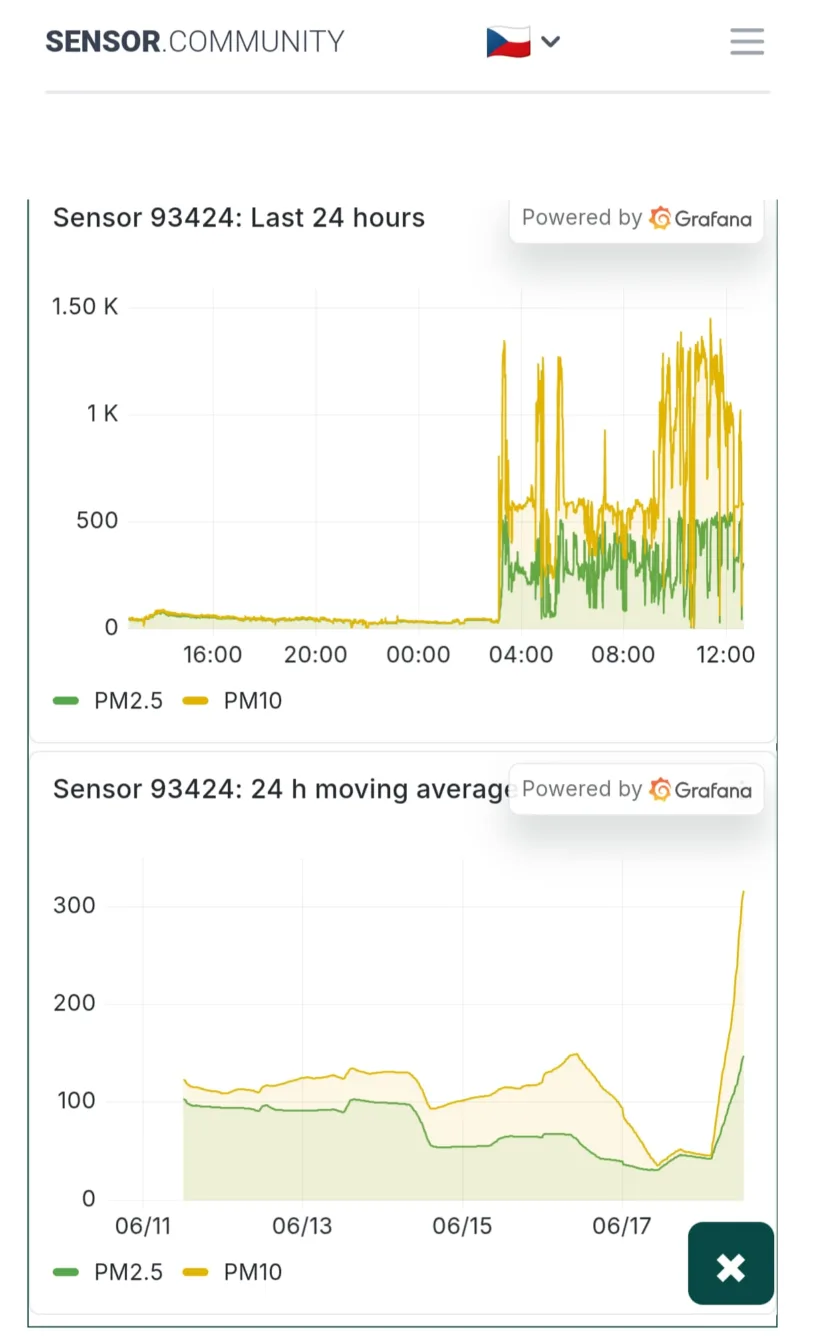
The difference between instantaneous values and the 24-hour rolling average is obvious. While the spikes are wild, the rolling average rises steadily but unmistakably – from long-term values around 100 µg/m³ to over 300 µg/m³. That is the signature of a sudden, intense and still-ongoing event right at the source.
The map shows why dispersion conditions matter
Of 68 visible sensors, only a few report extreme readings, mainly the one next to the refinery. All the others sit in the good range (cyan). The smoke therefore did not spread across the city – it stayed close to the source and its immediate surroundings.
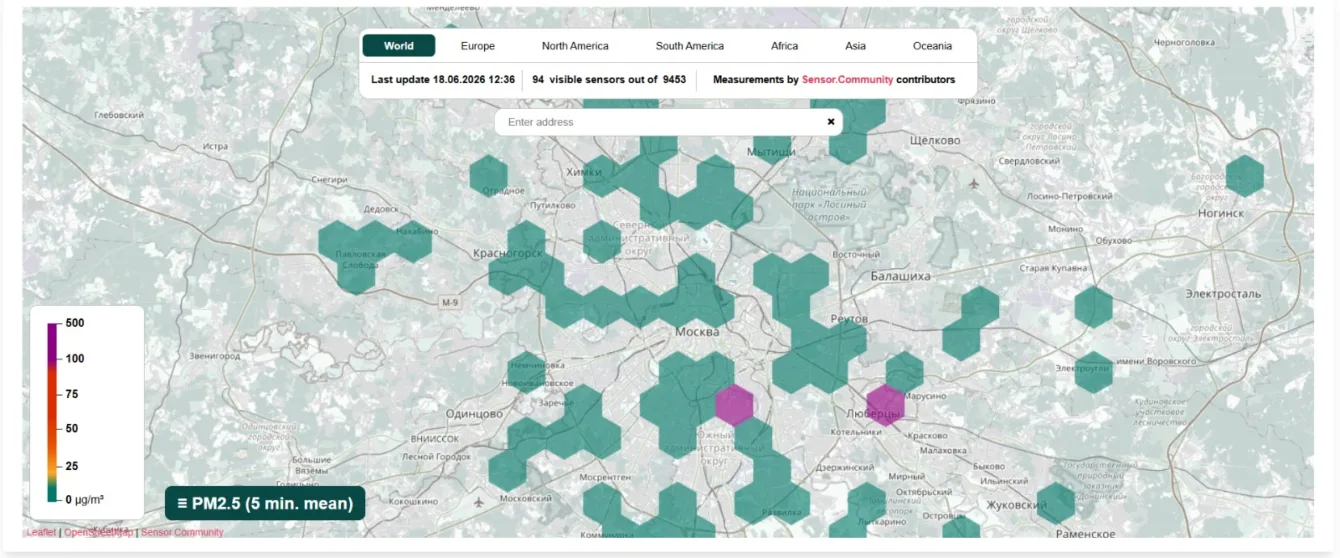
Dispersion conditions are responsible. When the atmosphere is well mixed and there is wind, pollution dilutes and spreads quickly, so even a strong point source does not affect air quality over a wider area. Moscow residents were fortunate in that respect – apart from those living right next to the refinery, most of the city was breathing good-quality air.
This is the exact opposite of the situations I described earlier. With the Quebec wildfire smoke and the fire in České Švýcarsko, the smoke traveled hundreds of kilometers and sensors across a wide region recorded degraded air quality – albeit at lower concentrations than we saw in Moscow.
Here we have a strictly local event – and the amateur network is precisely what can distinguish and locate it.
Why amateur measurements matter
This incident is a textbook demonstration of the value of a public sensor network. Without sensor 93424, we would have only photos of smoke and speculation about local degradation. With it, we have numbers, a time series, and the ability to separate a local anomaly from a city-wide problem.
Amateur particulate sensors have already caught significant events – besides the fires mentioned above, also the regular New Year’s fireworks. The more sensors the network has, the sharper the picture. And anyone can join.
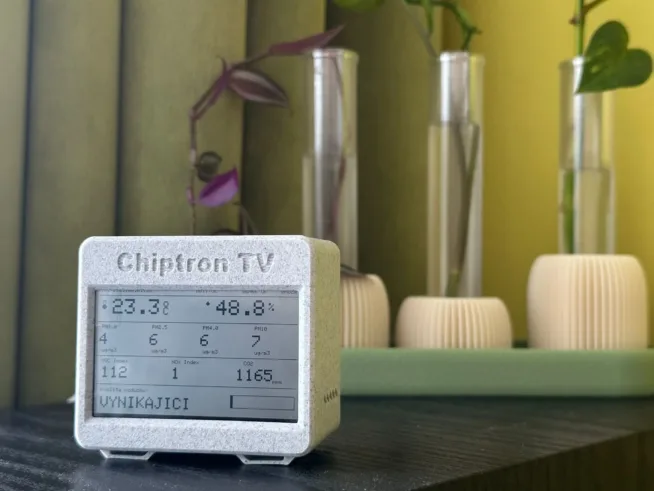
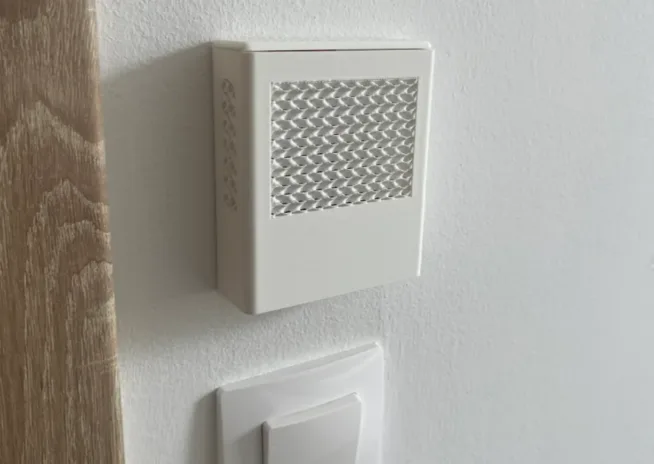
How to measure air quality yourself
Building your own outdoor weather station with particulate measurement is straightforward. A detailed guide is in the article Nicely finished 3D-printed outdoor weather station with accurate temperature, humidity and particulate measurements.
In short, you need:
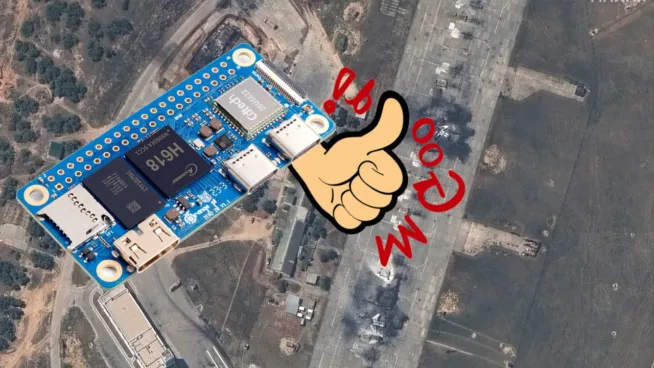
- Controller board – for example the LaskaKit AirBoard-8266 based on the ESP8266.
- Optical particulate sensor – SEN5x (SEN50/SEN54/SEN55) from Sensirion, which measures particulates and, on the higher models, also temperature, humidity, VOC and NOx index. Or the SEN63C.
- 3D-printed enclosure with radiation shield – ready models and remixes are linked in the article above.
- Power – from a USB-C adapter or solar with a battery (in the latter case remember to put both sensor and board to sleep).
You can store and visualize the data in TMEP.cz (a project similar to sensor.community but focused on Czechia and Slovakia), display it on ePaper via ZivyObraz.eu, or share it to the sensor.community network so your sensor becomes another point on the public map.
And that is the point – the more of us who measure, the better we all see what we are actually breathing.

